If you give an AI tool a CSV file, do you get a finished dashboard? I tested that claim under unusually favorable conditions. I downloaded the U.S. Geological Survey’s “M2.5+ Earthquakes, Past 30 Days” CSV and gave Codex a detailed, frozen prompt to build a local dashboard with filters, summary cards, charts, and a table.

This was not a live earthquake monitor, alert, map, or safety tool. It used a fixed snapshot downloaded on September 4, 2026 from a rolling 30-day feed. The official feed updates every minute, so the contents at the same URL can change. USGS describes the CSV as suitable for spreadsheet analysis and publishes its field definitions. USGS-produced information is generally identified as public domain in the United States, with source credit requested.
In this article
First, I defined “without coding”
Without a clear boundary, almost any assisted build can be called no-code. For the operator path, I allowed only four actions: send the frozen prompt, describe problems in plain language, copy the generated folder, and run the command exactly as written in the README. Opening or editing source code, naming functions, or pointing to line numbers would make the no-code test fail.
Codex performed this operator path. This was not a usability test in which a human non-developer operated the tool.
Verification was a separate task outside the operator path, so it did not count against the no-code test. Before generating the app, I froze the inclusion rules, missing-value policy, inclusive filter boundaries, UTC date grouping, magnitude bins, rounding, and empty-result behavior. A standalone Python checker calculated five test cases without importing the dashboard code. Because the checker was not independent of the experimenter, I call it a pre-registered answer key rather than fully independent verification.
The first screen looked right but meant the wrong thing
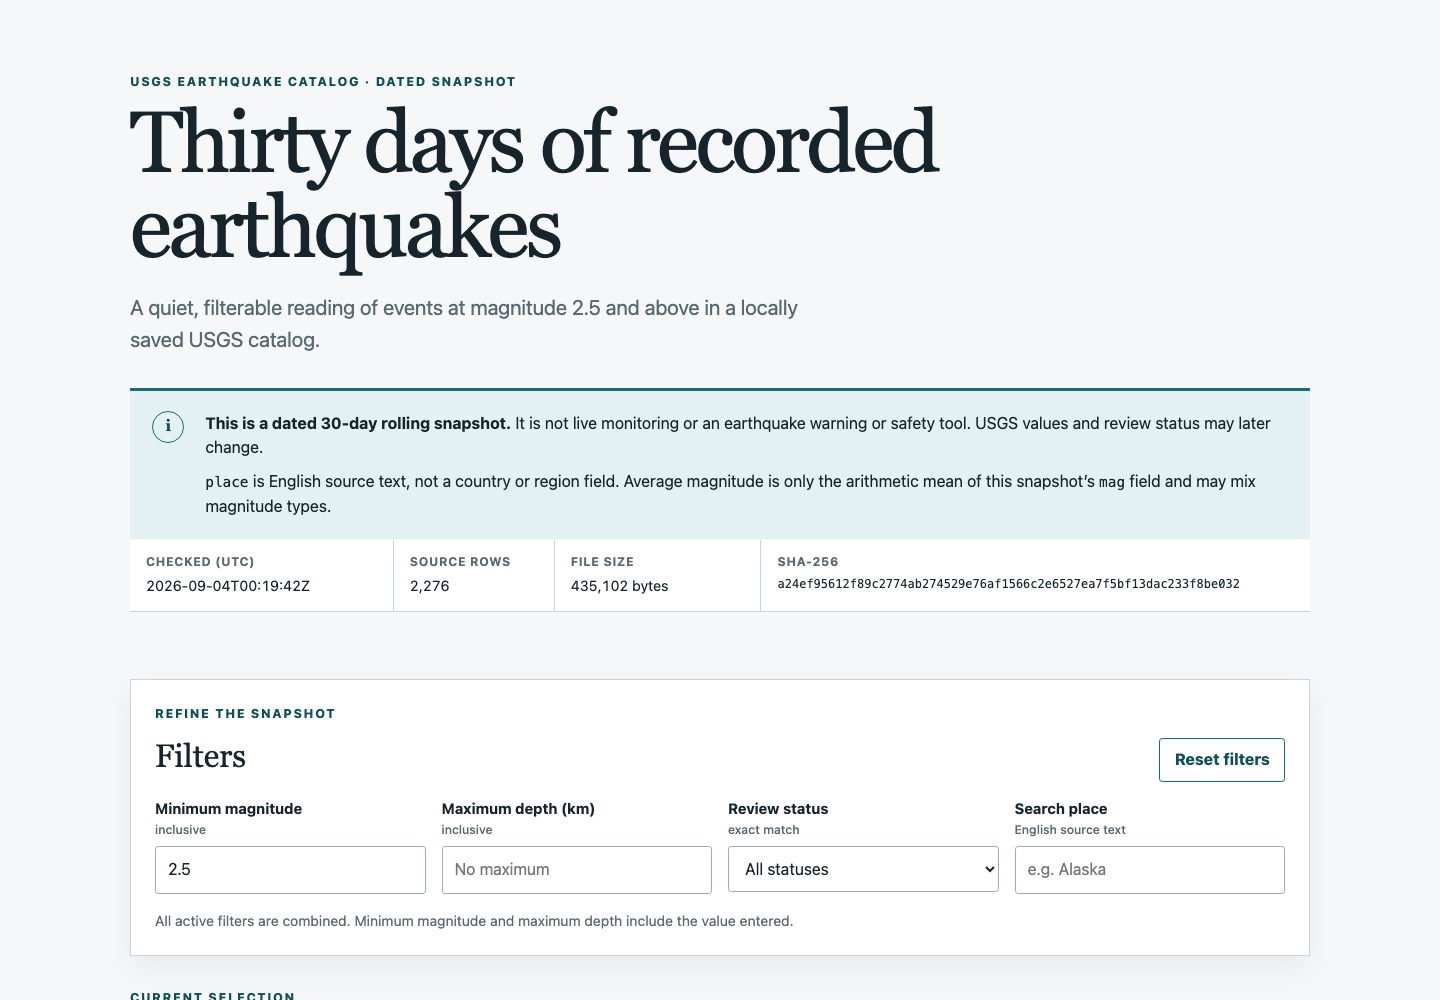
One detailed request to Codex CLI 0.149.0 using gpt-5.6-sol produced the HTML, CSS, JavaScript, and README in about five minutes. It needed no package installation or external chart library. It loaded the CSV locally, correctly handled location text containing commas, and provided four filters, four summary cards, two charts, and a table on the first run.
But the first result had a meaningful error. The interface said “magnitude 2.5 and above,” while leaving the minimum-magnitude default empty. It therefore showed all 2,274 rows remaining after the data had been limited by event type. A polished interface and a semantically correct interface were not the same thing.
The three counts belong to three different processing stages:
- 2,276 rows — the complete saved CSV: It contained 2,274 earthquakes and two
landsliderows. - 2,274 rows — after the type check: Removing the two landslides left only rows where
type=earthquake. The first screen stopped at this stage. - 2,257 rows — after the corrected default filter: Of the 2,274 earthquakes, 17 had a saved magnitude below 2.5. The
mag >= 2.5default excluded those 17 rows.
In short, 2,276 - 2 = 2,274, then 2,274 - 17 = 2,257. The type check removed two records that were not earthquakes. The next 17 were earthquakes, but their saved magnitudes fell below the dashboard’s default display threshold. A feed named “M2.5+” did not guarantee that every saved row was at or above 2.5.
I sent one plain-language correction: set the initial minimum magnitude and the Reset value to 2.5. I did not open the source files. The corrected default showed 2,257 events, matching the pre-registered calculation. I rated the first version a partial pass and the final version a pass after one plain-language revision.
Did the numbers hold up?
Across five pre-registered filter combinations, the dashboard matched the checker for row count, average and maximum magnitude, average depth, every magnitude bucket, and the sum of UTC daily buckets. Representative counts were:
- Magnitude 4.5 and above: 651 events
- Magnitude 3.0 and above, depth at or below 70 km, and
reviewedstatus: 1,195 events - Location text containing
Alaska: 855 events
The average magnitude was only an arithmetic mean of mag values spanning nine USGS magnitude-type (magType) categories. It was not an average of energy or damage.
All of these counts come from the snapshot saved on September 4, 2026 and may differ from the current official feed. None should be used for safety decisions.
The test automation once left the preceding case's reviewed status and maximum-depth values in place when it ran the Alaska case, displaying 756. After using the app's Reset control, the same case returned the correct 855, so I recorded this as a test-state initialization failure rather than an app calculation failure.
A minimum magnitude of 9.9 returned zero rows and displayed em dashes—not misleading zeros—for averages and maxima.
Synthetic error files produced visible behavior too. Rows with an invalid magnitude or a missing depth were excluded, and the app reported how many it had excluded. A header-only file, a missing required column, and a missing CSV produced actionable error messages rather than a blank page. On a 375×812 phone-sized screen, the page fit without horizontal scrolling. Filters and Reset were keyboard reachable, focus was visible, and every chart value was also available in a table. This was a limited accessibility check, not a claim of conformance with the Web Content Accessibility Guidelines (WCAG).
I reopened the exported folder by running the README's Python local HTTP server command in a terminal, and the app made no external network requests. No source editing was needed, but this was not a typical no-code service that includes GUI hosting.
There was no additional purchase, although the experiment used an existing ChatGPT Pro/Codex subscription, so calling it “free” would be misleading.
Generation took about five minutes, verification about eight minutes, and the correction about 30 seconds—roughly 14 minutes in total, excluding research and the earlier editorial interview.
The real work was defining “correct”
For one clean, well-documented official CSV, this Codex model, and a precise initial prompt, it was possible to reach a working dashboard without reading or editing code. Most features worked on the first run, and one plain-language correction fixed the only material default-state error.
Still, “upload a CSV and you are done” was not an honest summary. The most important failure was not a crash. It was a convincing interface showing a range that contradicted its own description. That mistake would have been easy to miss without defining three groups of checks first:
- Source and reuse terms, plus a frozen snapshot
- Calculation rules, missing values, and time zone
- Mobile layout, keyboard use, and error states
Before trying this workflow on another public CSV, check four things: Are reuse and attribution terms clear? Are the time, numeric, and category fields defined? Can you freeze a reproducible input instead of depending on a live API? Can you create a small answer key of filter cases? If not, verification effort may grow faster than the dashboard itself.
This was a best-case test of one documented USGS CSV. It does not establish that the same approach works for every public dataset, live connection, map, or safety-critical tool. AI can create the interface and calculations quickly. Saying “it works correctly” still requires the verification rules and evidence to be defined and checked separately.
Sources
- USGS Earthquake Hazards Program: CSV format and feed descriptions
- USGS: Copyright and credit guidance
AI was used to assist with research and drafting. The author independently verified and edited the final article.
 Build, Check, Repeat
댓글 남기기